
Home › Coverage › Norfolk › Norwich
NorfolkSolar panels in Norwich,
priced honestly.
Independent guidance on solar and battery storage for Norwich homes in Norfolk: a free remote design call first, then an MCS-certified installation team for your area if you decide to go ahead. PVGIS puts a roof in Norwich at 1,033 kWh per kWp a year, level with our Norfolk county estimate.
Start with your postcode
Free, no obligation. Takes about two minutes, and nobody visits your home.
What a roof in Norwich can generate
Real satellite data for Norwich, real installed pricing, and the same honest model we run for every place we cover.
How Norwich compares
Norwich is classed as a city in the House of Commons Library settlement data, home to 206,199 people. It is one of 16 Norfolk towns we track, and it ranks 9th of 16 for solar yield. Its 1,033 kWh per kWp a year works out at 2.83 peak sun hours a day, and running the standard 12 panel model here splits the return into £247 of savings from generation you use yourself and £676 of export income at 12p, with about 5,633 kWh a year going to the grid.
Treat these as calibration rather than a quote. The calculator below runs the same model, defaulted to Norwich's own yield, and at Norwich's 1,033 kWh per kWp it prices a 12 panel system at £6,360 installed before any battery. Your free design call reworks every number for your actual roof, its shading and your usage.
Norwich is the planning authority covering Norwich, which the House of Commons Library classes as a city.
The charger is in the installed price but left out of payback: charging savings depend on your mileage and tariff, which the design call models properly.
Price this properly, free →Your real roof, your real usage, on a free video call. No obligation.
A 12 panel, 6.36 kWp system in Norwich generates around 6,570 kWh a year, worth around £923 in year one on the 12p export scenario.
Generation is modelled from PVGIS satellite data for Norwich's own coordinates (52.64118, 1.2862), using the same 26.32p/kWh import value and £1,000 per kWp installed pricing as every Clearline estimate, with the full methodology, sourcing and assumptions set out on our help page.
Local detail for Norwich
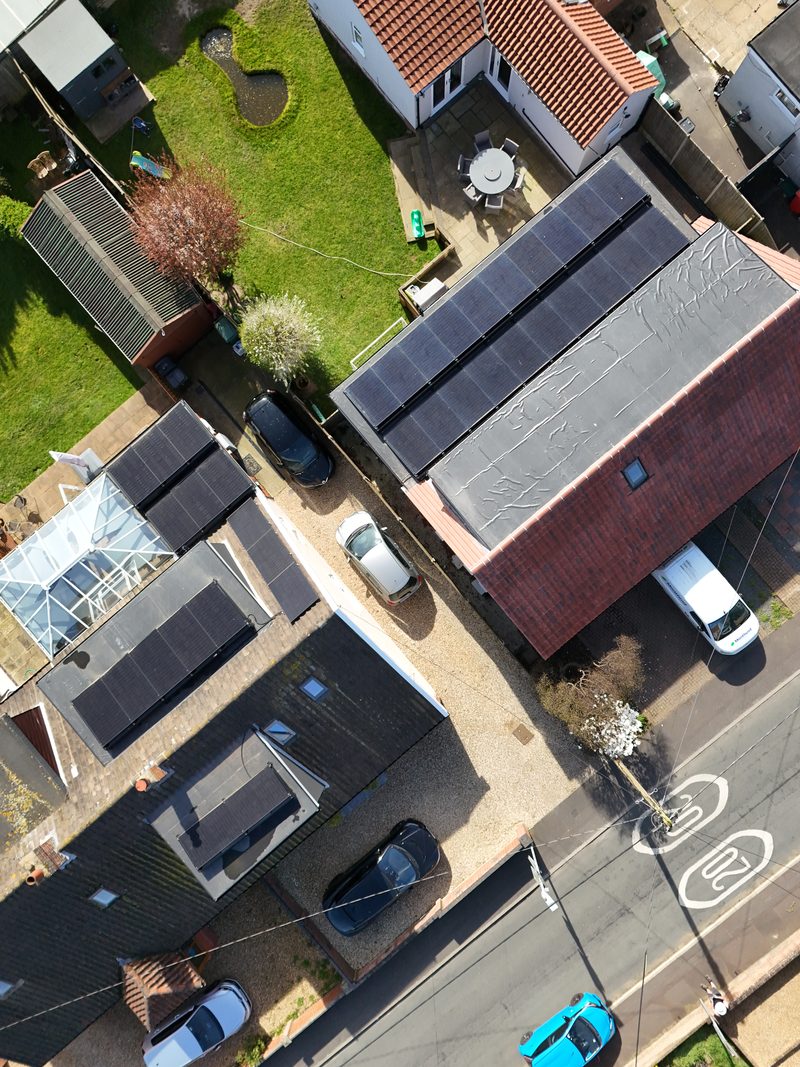
Norwich has an unusually compact historic core, home to more medieval churches than any other city in Western Europe north of the Alps, with half-timbered and Georgian townhouses lining its medieval street pattern. Around that centre, large areas of Victorian terraced housing were built, though much of the terrace stock nearest the centre was cleared for post-war redevelopment and replaced with estates and high-rise blocks, so a Norwich roof ranges from a steep, sometimes listed pitch in the core to a flatter post-war roof further out.
Norwich sits in UK Power Networks territory, on its Eastern Power Networks licence. UK Power Networks runs a G99 Fast Track alongside its standard route; the general 45 working day industry standard is the figure to plan against for a standard quotation, and most single home systems use the quicker 28-day G98 route instead. Norwich City Council is the planning authority, covering 17 conservation areas, around 1,500 listed buildings and 24 scheduled monuments.
The council is targeting net zero for its own operations by 2030 and net zero for Norwich as a whole by 2045, a twin target that separates what the council controls directly from the wider city. Riverside Leisure Centre has already had 724 solar panels fitted, now generating over a third of the site's electricity, on top of the council's own Switch Together group-buying scheme open to residents.
Network operator (DNO): UK Power Networks · G99 application
Planning authority: Norwich City Council
Solar panel servicing and repair in Norwich
Faults, servicing and ageing inverters follow the same economics in Norwich as anywhere else, and the guides below price them plainly.
Common questions about solar in Norwich
What could a roof in Norwich generate?
PVGIS puts a roof in Norwich at 1,033 kWh per kWp a year, 2.83 peak sun hours a day averaged across the seasons.
What does a typical solar system cost in Norwich?
A typical 12 panel, 6.36 kWp system in Norwich costs around £6,360 installed, at £1,000 per kWp before any battery.
Would a system in Norwich need a G99 application?
Most home solar and battery systems qualify for the simpler G98 notification, made to the network operator (DNO) after installation rather than before. A minority, usually larger systems, need the fuller G99 process instead. Your design call checks which applies in Norwich before anything is booked; our G98 vs G99 guide explains the difference in full.
What could I earn from exporting in Norwich?
On the 12p export scenario, that 12 panel system sends about 5,633 kWh a year to the grid, worth around £676. The tariff guide compares the export rates that could apply to your setup.
Get your free quote
Takes about two minutes. We work out your options, then confirm your free remote design call, on video, at a time that suits you. It starts with your roof and your numbers, and the design is built around them rather than around a product someone needs to shift.
Reading for Norwich homeowners
Independent, sourced and dated. The same ground we cover on your free call.
Do solar panels work in winter? Yes, just less than summer
Panels run on light, not sunshine. Cloud turns them down, not off. What that means for an awkward roof.
Read the guide →What a battery gateway actually does
Without a gateway your system shuts down when the grid does. Here is what the box actually does.
Read the guide →Home EV charger types and speeds, explained properly
Granny cable, 7kW wall unit or 22kW three phase. What each adds per hour, and which you need.
Read the guide →Are heat pumps noisy? The 37 dB(A) answer, in plain terms
The 1 metre boundary rule is gone. A 37 dB(A) sound test replaced it.
Read the guide →Why the best export rates always carry conditions
The top export rates are acquisition offers. Here is how to price the condition.
Read the guide →G98 or G99: which one applies, what the application involves, and how long it takes
The G98 line sits at 3.68kW per phase. Above it, your network operator has to say yes first.
Read the guide →How Norwich compares with its neighbours
Same satellite dataset, same assumptions, so the differences are real geography rather than modelling noise.
| Town | kWh per kWp | Peak sun hours | vs Norwich |
|---|---|---|---|
| Norwich | 1,033 | 2.83 | — |
| Taverham and Drayton | 1,026 | 2.81 | -7 kWh |
| Hethersett | 1,034 | 2.83 | +1 kWh |
| Wymondham (South Norfolk) | 1,036 | 2.84 | +3 kWh |
| North Walsham | 1,050 | 2.88 | +17 kWh |
| Attleborough | 1,036 | 2.84 | +3 kWh |
| Dereham | 1,028 | 2.82 | -5 kWh |
PVGIS v5.2 for each town centroid, identical assumptions throughout. A few kWh either way is weather-year noise; a spread beyond about 30 kWh per kWp is real geography.
Also for Norwich: Solar panels in Norwich from OVO Solar & Battery