
Middlesex

Solar panels in City and County of the City of London.
Twelve panels here make about 6,530 kWh a year for £6,360 installed, designed on a free 30-minute video call.
Get my free quote
Three details. We call or text within one working day to book your free 30-minute design call, on video or by phone if you prefer.
or call 07782 219224
- Free 30-minute video design call
- Priced before anyone visits
- Installed by our MCS-certified, fully insured teams
Sunlight in City and County of the City of London, in numbers
From 37.5 kWh per kWp in December to 125.4 in July: a roof in City and County of the City of London makes 3.3 times as much in its best month as in its darkest, and 1,026 kWh per kWp across the year.
Generation per kWp, month by month
Show the monthly figures
| Month | kWh/kWp |
|---|---|
| January | 40.1 |
| February | 53 |
| March | 88.1 |
| April | 115 |
| May | 122 |
| June | 123 |
| July | 125 |
| August | 111 |
| September | 96.5 |
| October | 67.9 |
| November | 47.6 |
| December | 37.5 |
Source: PVGIS v5.2 (European Commission JRC), SARAH3 database, 1 kWp, 14% system loss, 35 degree pitch, due south, checked September 2026.
For scale: 1,026 kWh per kWp in City and County of the City of London against 925, our GB average (the mean of our 85 county PVGIS estimates), which puts City and County of the City of London 11% above it.
How City and County of the City of London compares
City and County of the City of London is one of 23 Middlesex towns we track, and it ranks joint 5th of 23 for solar yield. The House of Commons Library settlement classification puts it in the core city class, with a population of 13,979, which makes it one of the largest places we publish figures for. Scale changes nothing about the physics: PVGIS gives a roof here 1,026 kWh per kWp a year, 2.81 peak sun hours a day averaged across the seasons, and on the 12p scenario about £247 of the year one benefit comes from solar you use yourself, with export income adding £671.
These are starting numbers, not a quote. The calculator below opens on City and County of the City of London's own PVGIS figure; change the panels, the battery or the export rate and it reruns. The design call replaces every assumption with your roof and your bills.
Planning applications here go through City of London; nationally, the House of Commons Library classes City and County of the City of London as a core city.
The charger is in the installed price but left out of payback: charging savings depend on your mileage and tariff, which the design call models properly.
Your real roof and usage, worked through on a free 30-minute video call. Use the full form or leave three details below.
Price this for your roof
Three details. We call or text within one working day to book your free 30-minute design call, on video or by phone if you prefer.
The figures use PVGIS for the centre of City and County of the City of London (51.51476, -0.09205), a 26.32p/kWh import price and £1,000 per kWp installed; see the help page for the full method.
The network operator for City and County of the City of London
City and County of the City of London is served by UK Power Networks: the town's centre falls inside its London licence area on NESO's boundary map.
Most home systems stay within 3.68kW per phase of inverter output, which puts them on G98, a notification to UK Power Networks within 28 days of switch-on. Panel count does not decide it; the inverter and any battery do.
Above that, G99 means applying before the work is booked. Ofgem's guaranteed standard for a low voltage generation connection quotation is 45 working days, with £80 paid for each working day late, and it binds UK Power Networks as it does every network operator.
Sources: NESO DNO licence areas (3 May 2024); Ofgem, Distributed Generation Standards Direction guidance, checked 27 September 2026. G98 vs G99, explained.

Adding a heat pump or an EV charger in City and County of the City of London

A heat pump in City and County of the City of London
In December, the darkest month here, 12 panels in City and County of the City of London make about 240 kWh. That is when a heat pump runs hardest, so its running cost in City and County of the City of London comes down to the tariff and the flow temperature rather than the roof.
The Boiler Upgrade Scheme, open in England and Wales, takes £7,500 off an air source or ground source heat pump, or £2,500 off an air-to-air unit. Homes on oil or LPG with no mains gas get £1,500 more until March 2027 (gov.uk, checked 28 September 2026).

Charging an EV in City and County of the City of London
City and County of the City of London's July output, about 800 kWh from 12 panels, is several times the 70 kWh or so a typical home uses in daylight that month on our calculator's settings. Daytime charging turns that surplus into miles.
Renters and flat owners with private off-street parking can get 75% off a chargepoint and its installation, up to £500 per socket, until 31 March 2027 (gov.uk, checked 28 September 2026). The calculator above adds a 7.4kW smart charger from £1,100 installed.
What the named kit costs, installed
Every system is designed around your roof on the free call before anything is fitted.
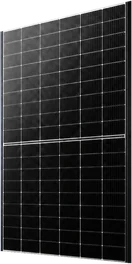
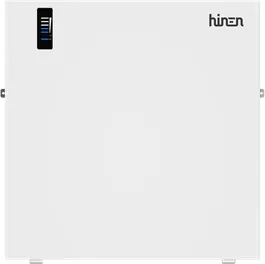
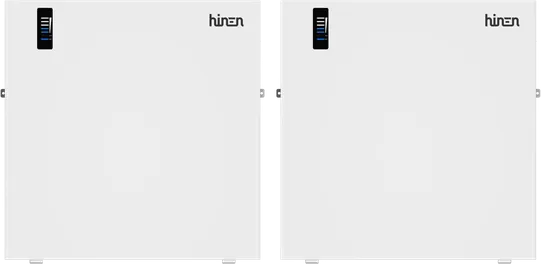
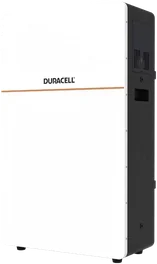
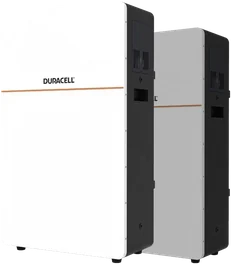
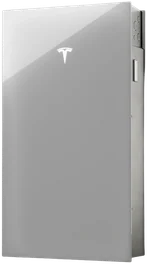
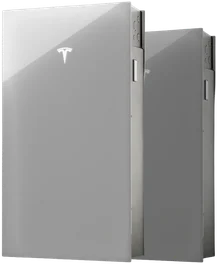
Solar panel servicing and repair in City and County of the City of London
The same sourced benchmarks apply in City and County of the City of London as everywhere we cover: honest repair pricing and what a service should include.
Common questions about solar in City and County of the City of London
How much electricity do solar panels make in City and County of the City of London?
About 6,530 kWh a year from 12 panels (6.36 kWp), on PVGIS satellite data for City and County of the City of London: 1,026 kWh per kWp, or 2.81 peak sun hours a day on average. July is the strongest month, at about 800 kWh.
Is solar more expensive in City and County of the City of London?
Prices on this site are the same everywhere: £1,000 per kWp installed, which puts a 12-panel system at £6,360 in City and County of the City of London, and a Duracell Dura16 installed with solar at £4,450 on top. The local part is generation, about 6,530 kWh a year here, which is what drives payback.
Which DNO covers City and County of the City of London, and what does it need from me?
UK Power Networks covers City and County of the City of London. A home system of up to 3.68kW per phase is notified to UK Power Networks within 28 days of commissioning under G98, and nothing waits on approval. Larger outputs need a G99 application before work starts. Ofgem's guaranteed standard for a low voltage generation connection quotation is 45 working days, with £80 paid for each working day late, and it binds UK Power Networks as it does every network operator.
What could I earn from exporting in City and County of the City of London?
On the 12p export scenario, a 12-panel system in City and County of the City of London sends about 5,589 kWh a year to the grid, worth around £671. The export rates table compares what each supplier pays.
How much solar does City and County of the City of London get in December?
December is the low point: about 240 kWh from a 12-panel system in City and County of the City of London, on PVGIS data, rising to 800 kWh in July. From November to February the same system makes about 1,130 kWh in total, which is why a battery charged off-peak does more of the work in winter.
How City and County of the City of London compares with its neighbours
How the towns nearest City and County of the City of London compare on the same PVGIS settings, closest first.
| Town | kWh per kWp a year | vs City and County of the City of London |
|---|---|---|
| City and County of the City of London | 1,026 | this town |
| Tower Hamlets | 1,023 | −3 kWh |
| Islington | 1,026 | level |
| Hackney | 1,025 | −1 kWh |
| Southwark | 1,029 | +3 kWh |
| City of Westminster | 1,026 | level |
| Camden | 1,026 | level |
PVGIS v5.2 for each town centroid, identical assumptions throughout. A few kWh either way is weather-year noise; a spread beyond about 30 kWh per kWp is real geography.
Also for City and County of the City of London: Solar panels in City and County of the City of London from OVO Solar & Battery
See a number before you speak to anyone
Answer a few questions about your roof and usage and see an instant solar and battery estimate. No email needed to see the result.
Reading for City and County of the City of London homeowners
Sourced, dated and written by us. The same ground we cover on your free call.
Microinverters, optimisers or a plain string inverter: who needs what
Shade and roof layout decide this. An honest triage of the three approaches.
Read the guide →Whole home backup or partial backup? The runtime arithmetic
Whole home backup sounds obvious until you do the runtime maths. Here is how to choose the right tier.
Read the guide →Smart charge point regulations, explained
Why your charger arrives pre-set to charge overnight, and why it waits before it starts.
Read the guide →Are heat pumps noisy? The 37 dB(A) answer, in plain terms
The 1 metre boundary rule is gone. A 37 dB(A) sound test replaced it.
Read the guide →What the Smart Export Guarantee actually is
The scheme obliges suppliers to pay above zero, and leaves the rate to them.
Read the guide →HIES explained: what the badge actually protects, and when
What HIES protects: deposits up to 25 percent capped at 5,000 pounds, and your workmanship guarantee.
Read the guide →Get my free quote
Takes about two minutes. We call or text within one working day to book your free 30-minute video design call at a time that suits you. We design it around your roof and your numbers, and our MCS-certified, fully insured installation teams install it.