
Warwickshire, England

Solar panels in Warwickshire, priced before anyone visits.
Twelve panels (6.36 kWp) here make about 6,340 kWh a year for £6,360 installed, designed around your roof on a free 30-minute video call.
Get my free quote
Three details. We call or text within one working day to book your free 30-minute design call, on video or by phone if you prefer.
or call 07782 219224
- Free 30-minute video design call
- Priced before anyone visits
- Installed by our MCS-certified, fully insured teams
Sunlight in Warwickshire, in numbers
From 35.3 kWh per kWp in December to 122 in July: a roof in Warwickshire makes 3.5 times as much in its best month as in its darkest, and 997 kWh per kWp across the year.
Generation per kWp, month by month
Show the monthly figures
| Month | kWh/kWp |
|---|---|
| January | 37.3 |
| February | 54.2 |
| March | 88 |
| April | 110 |
| May | 121 |
| June | 119 |
| July | 122 |
| August | 109 |
| September | 93 |
| October | 64 |
| November | 44.2 |
| December | 35.3 |
Source: PVGIS v5.2 (European Commission JRC), SARAH3 database, 1 kWp, 14% system loss, 35 degree pitch, due south, checked September 2026.
Against Great Britain as a whole: Warwickshire makes 997 kWh per kWp a year, and the mean of our 85 county PVGIS estimates (our GB average) is 925, so Warwickshire is 8% above it.
How Warwickshire compares
Warwickshire ranks 28th of the 85 counties we track for solar yield, level with the England average of our estimates. At 2.73 peak sun hours a day the sums lean on a healthy mix: £247 of the year one benefit here comes from solar you use yourself, with export at 12p adding £649.
Every figure here assumes a clear, south-facing roof at 35 degrees in the middle of Warwickshire. Yours will differ; the calculator below lets you test panels, batteries and export rates first.
The charger is in the installed price but left out of payback: charging savings depend on your mileage and tariff, which the design call models properly.
Your real roof and usage, worked through on a free 30-minute video call. Use the full form or leave three details below.
Price this for your roof
Three details. We call or text within one working day to book your free 30-minute design call, on video or by phone if you prefer.
Generation from PVGIS v5.2 (European Commission JRC, SARAH3), retrieved August 2026 for a representative point in Warwickshire (52.3335, -1.586), assuming 1 kWp, 14% system loss, 35 degree pitch, due south. Import valued at 26.32p/kWh (Ofgem price cap average, Oct to Dec 2026); off-peak charging at 8.5p/kWh where used (a supplier's published off-peak rate, checked September 2026); export at the scenario you pick, from the dated tariff table. Prices are installed pricing, August 2026, standard installations; 530W LONGi panels at £1,000 per kWp. Estimates for illustration, not a quote: your free design call prices your actual roof.
The network operator for Warwickshire
On NESO's licence-area map, the middle of Warwickshire falls in East Midlands, which National Grid Electricity Distribution (NGED) operates, and so do all the towns we cover in the county.
What decides the paperwork is the inverter and battery output, not the number of panels. Up to 3.68kW per phase, a system follows G98: NGED is notified within 28 days of commissioning and nothing has to be approved first.
Larger systems go through G99 instead, applied for before installation. On timing: NGED's guaranteed standards give 45 working days for a low voltage generation quotation, with £80 paid for each working day late.
Sources: NESO DNO licence areas (3 May 2024); NGED, guaranteed standards of performance table, checked 25 September 2026. G98 vs G99, explained.

Beyond the panels: heating and car charging in Warwickshire

A heat pump in Warwickshire
Heating demand peaks when solar is weakest. In Warwickshire, a 12-panel system makes about 220 kWh in December and 240 kWh in January, a fraction of its 780 kWh in July, which is why a heat pump here is costed on its tariff first.
Grant support in England comes from the Boiler Upgrade Scheme: £7,500 for an air source or ground source heat pump, £2,500 for air-to-air, and an extra £1,500 until March 2027 where the home is heated by oil or LPG off the gas grid (gov.uk, checked 28 September 2026).

Charging an EV in Warwickshire
Summer is where a car earns its place. In July, 12 panels in Warwickshire make about 780 kWh, against roughly 70 kWh a typical home uses in daylight that month on our calculator's typical-use settings, so there is surplus a smart charger can put into the car instead of exporting it.
If you rent, or own a flat, and have private off-street parking, the government chargepoint grant covers 75% of the cost, capped at £500 a socket, until 31 March 2027 (gov.uk, checked 28 September 2026). The calculator above prices a 7.4kW smart charger from £1,100 installed.
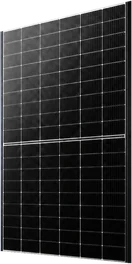
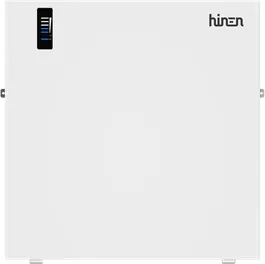
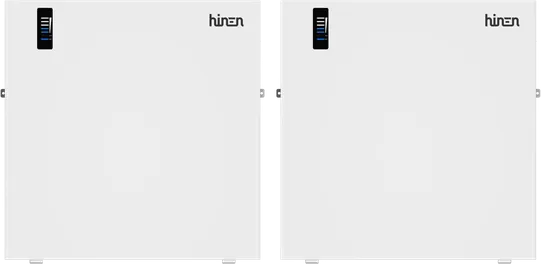
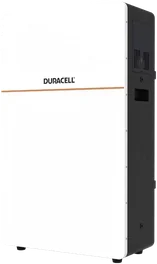
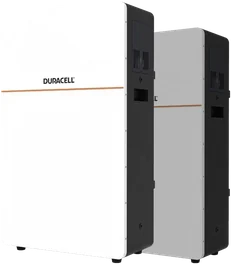
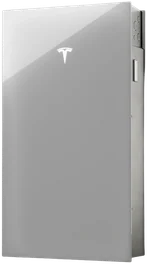
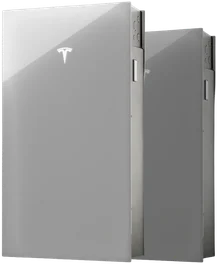
Installed prices, the same across Warwickshire
Every system is designed around your roof on the free call before anything is fitted.
Common questions about solar in Warwickshire
How much energy would 12 solar panels make in Warwickshire?
Warwickshire averages 2.73 peak sun hours a day, which PVGIS turns into 997 kWh per kWp a year. On a 12-panel, 6.36 kWp roof that is about 6,340 kWh, 68% of it between April and September.
What does a typical solar system cost in Warwickshire?
Solar is priced at £1,000 per kWp installed wherever you live, so a 12-panel, 6.36 kWp system costs £6,360 in Warwickshire, exactly as it would anywhere else, before any battery. Location changes what the system makes, not what it costs: here that is about 6,340 kWh a year. The final figure comes from your roof on the design call.
Who is the network operator in Warwickshire, and do I need a G99 application?
The operator is National Grid Electricity Distribution (NGED). Most home systems use the G98 route, a notification within 28 days of switch-on for up to 3.68kW per phase, so nothing waits on the network. Above that, G99 applies and has to be granted first. NGED's guaranteed standards give 45 working days for a low voltage generation quotation, with £80 paid for each working day late. Your design call checks which route yours needs.
What happens to the solar I do not use in Warwickshire?
Around £649 a year at 12p per kWh, for the roughly 5,404 kWh a 12-panel system in Warwickshire exports with typical use. Rates vary by supplier and some need their own tariff; the export rates table is dated and sourced.
How does solar perform in Warwickshire in the winter months?
December is the weakest month in Warwickshire: about 220 kWh from 12 panels, against 780 kWh in July. The panels still generate on bright winter days; they just cover a smaller share of what the house uses.
Towns we cover in Warwickshire
19 Warwickshire towns have their own page, each with PVGIS figures, a network operator and a monthly curve for its own location.
See a number before you speak to anyone
Answer a few questions about your roof and usage and see an instant solar and battery estimate. No email needed to see the result.
Reading for Warwickshire homeowners
The same guidance we would talk through on your call, written down and sourced.
Solar panel types, and the four numbers that actually matter
TOPCon, HJT and back contact decoded, plus the four numbers worth comparing.
Read the guide →Adding a battery to solar panels you already own
Retrofitting a battery to working solar is straightforward. The paperwork is where people trip up.
Read the guide →Smart charge point regulations, explained
Why your charger arrives pre-set to charge overnight, and why it waits before it starts.
Read the guide →Heat pump running costs versus a gas boiler, assumptions shown
Four numbers decide it: seasonal efficiency, flow temperature, tariff and heat demand.
Read the guide →Why the best export rates always carry conditions
The top export rates are acquisition offers. Here is how to price the condition.
Read the guide →Your MCS certificate: what it shows, when it arrives, and how a Smart Export Guarantee supplier uses it
The document your export payments hang on. Who issues it, what it shows, and how to get a copy.
Read the guide →Get my free quote
Takes about two minutes. We call or text within one working day to book your free 30-minute video design call at a time that suits you. We design it around your roof and your numbers, and our MCS-certified, fully insured installation teams install it.